Gold price continues to move sideways. It is trapped between $1,295 and $1,282. The trend is neutral in the short term but bullish overall. We continue to see $1,320 as a short-term target.

I expect Gold price to respect support and start a new upward move soon. Short-term support lies at $1,282 and the resistance is found at $1,295. Short-term target is minimum at $1,320. Breaking below $1,275 will put short-term trend in danger and will likely push the price towards $1,250.
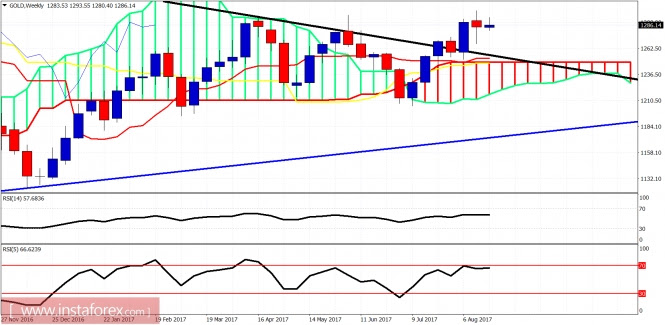
Blue line - long-term support
Gold price has broken out and above the black trend line resistance and the Ichimoku cloud. We could see another back test of the breakout area at $1,250 but overall trend is bullish and we are targeting above $1,400 over the coming months.
The material has been provided by InstaForex Company - www.instaforex.com


No comments:
Post a Comment