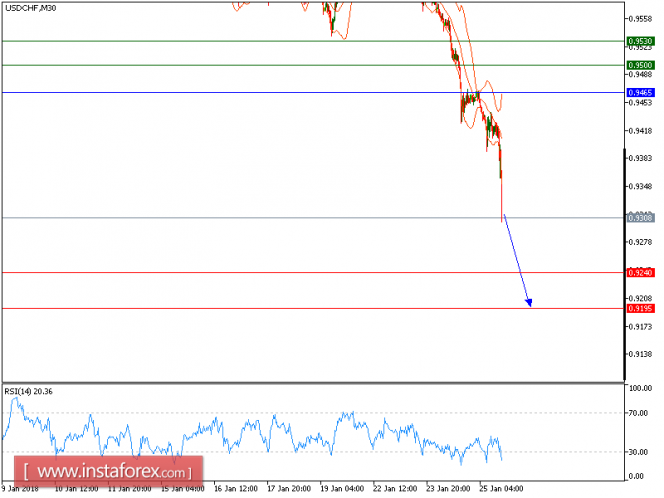
USD/CHF is under pressure and expected to prevail the downside movement. The pair is still heading downward, and is likely to post a new decline. The falling 50-period moving average should maintain the strong selling pressure on the prices. Last but not least, the relative strength index is below its neutrality area at 50, and calls for a new pullback.
To sum up, as long as 0.9465 is not surpassed, look for 0.9240 and 0.9195 in extension.
Chart Explanation: The black line shows the pivot point. The present price above the pivot point indicates a bullish position, and the price below the pivot point indicates a short position. The red lines show the support levels and the green line indicates the resistance levels. These levels can be used to enter and exit trades.
Strategy: SELL, stop loss at 0.9465, take profit at 0.9240.
Resistance levels: 0.9500, 0.9530, and 0.9540
Support levels: 0.9240, 0.9195, and 0.9140.
The material has been provided by InstaForex Company - www.instaforex.com


No comments:
Post a Comment