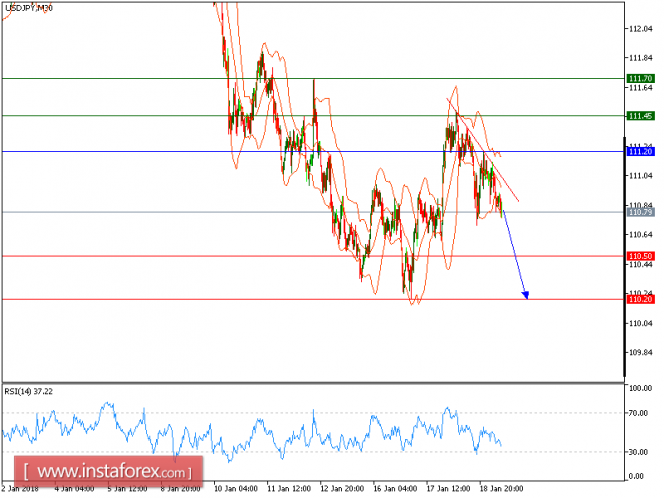
USD/JPY is under pressure. The pair retreated from 111.45 (the high of January 18) and recorded the process of lower tops and lower bottoms, which confirmed a negative outlook. The downward momentum is further reinforced by both declining 20-period and 50-period moving averages. The relative strength index is mixed to bearish.
Therefore, below 111.20, look for a new drop with targets at 110.50 and 110.20 in extension.
Alternatively, if the price moves in the opposite direction, a long position is recommended above 111.20 with a target of 111.45.
Chart Explanation: The black line shows the pivot point. The current price above the pivot point indicates a bullish position, while the price below the pivot point is a signal for a short position. The red lines show the support levels and the green line indicates the resistance level. These levels can be used to enter and exit trades.
Strategy: SELL, stop loss at 111.20, take profit at 110.50.
Resistance levels: 111.45, 111.70, and 112.05
Support levels: 110.50, 110.20, and 109.65.
The material has been provided by InstaForex Company - www.instaforex.com


No comments:
Post a Comment