The pair had a bearish journey during Wednesday's session as the price action consolidates below the 200 SMA and remains well supported by the 1.3939 level, which is the last hurdle before reaching the 1.3753 level. If bulls regain the control, the next target to the upside would be the 1.4078 zone.
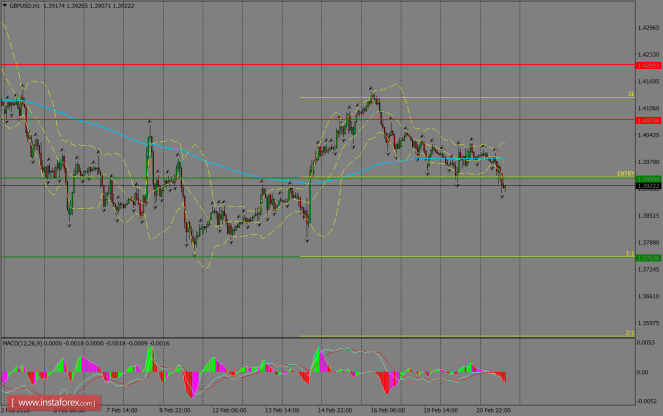
H1 chart's resistance levels: 1.4078 / 1.4209
H1 chart's support levels: 1.3939 / 1.3753
Trading recommendations for today: Based on the H1 chart, sell (short) orders only if the GBP/USD pair breaks a bearish candlestick; the resistance level is at 1.3939, take profit is at 1.3753 and stop loss is at 1.4130.
The material has been provided by InstaForex Company - www.instaforex.com


No comments:
Post a Comment