The pair is back below the 200 SMA at the H1 chart, finding support around the 1.3939 level, which should provide a bottom for the short-term. If such area gives up, then the doors will open for a testing of the 1.3753 level. To the upside, the critical level still lies at 1.4078. MACD indicator remains steady in the negative territory, favoring to the bears.
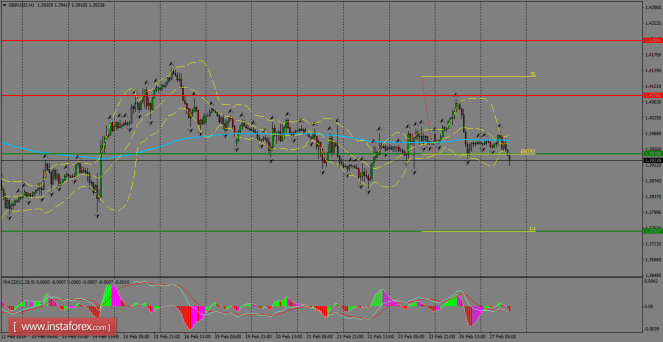
H1 chart's resistance levels: 1.4078 / 1.4209
H1 chart's support levels: 1.3939 / 1.3753
Trading recommendations for today: Based on the H1 chart, sell (short) orders only if the GBP/USD pair breaks a bearish candlestick; the resistance level is at 1.3939, take profit is at 1.3753 and stop loss is at 1.4130.
The material has been provided by InstaForex Company - www.instaforex.com


No comments:
Post a Comment