The US dollar index pulled back yesterday towards the broken resistance of 89.60 and is now bouncing again. The trend has changed to bullish in the short term. The US dollar index has many chances of finishing the entire decline from 103.60.
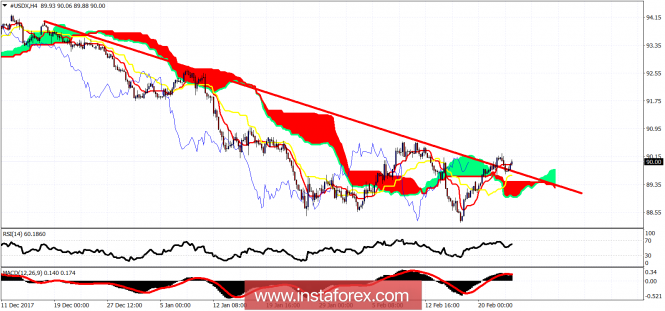
The US dollar index is trading above both the tenkan- and the kijun-sen. The price is also above the red downward sloping trend line from 94. The US dollar index will at least make a corrective bounce of the decline from 95.15. The most probable target is at 92.50.
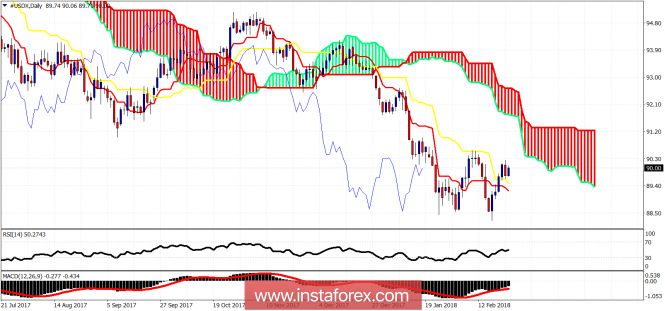
The daily trend remains bearish. The price has moved above the tenkan- and kijun-sen indicators. As long as the price is above the 89.45-89.20 support area by these two indicators, I would expect the price to move towards the daily Kumo (cloud) resistance at 91. The horizontal resistance of a the previous high is at 90.60. So it will be a bullish sign if we break above 90.60.
The material has been provided by InstaForex Company - www.instaforex.com


No comments:
Post a Comment