Daily Outlook
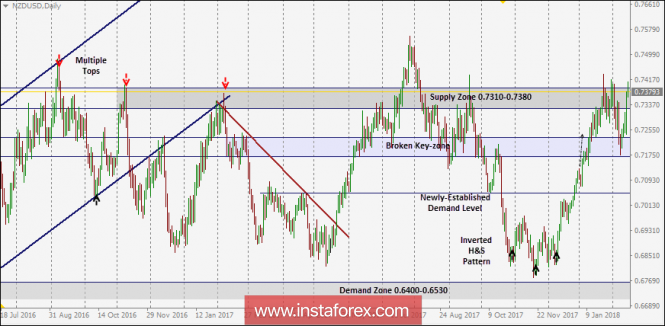
In July 2017, an atypical Head and Shoulders pattern was expressed on the depicted chart which indicated upcoming bearish reversal.
As expected, the price level of 0.7050 failed to offer enough bullish support for the NZD/USD pair. That's why, further bearish decline was expected towards 0.6800 (Reversal pattern bearish target).
Evident signs of bullish recovery was expressed around the depicted low (0.6780). An inverted Head and Shoulders pattern was expressed around these price levels.
The price zone of 0.7140-0.7250 (prominent Supply-Zone) failed to pause the ongoing bullish momentum. Instead, a bullish breakout above 0.7250 was expressed on January 11.
That's why, the current bullish movement extended towards the price levels of 0.7320 and 0.7390.
A quick bullish movement was expected towards the depicted supply zone (0.7320-0.7390) where evident bearish rejection and a valid SELL entry were expected.
On February 2, a bearish engulfing daily candlestick was expressed. This enhances the bearish scenario initially towards the price levels of 0.7230 - 0.7165 where recent bullish recovery was expressed.
Bearish fixation below 0.7160 is needed to allow further bearish decline towards 0.7090.
On the other hand, the price zone (0.7320-0.7390) remains a significant supply zone to be watched for possible bearish rejection and another SELL entry. Stop Loss should be placed above 0.7470.
The material has been provided by InstaForex Company - www.instaforex.com


No comments:
Post a Comment