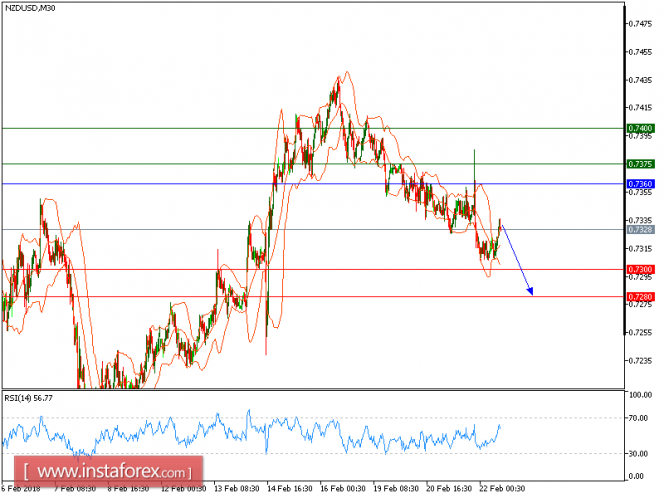
Our first downside target which we predicted in yesterday's analysis has been hit. NZD/USD is Under pressure. The pair is trading below its declining 20-period and 50-period moving averages, which play resistance roles and maintain the downside bias. The relative strength index is bearish and calls for a further downside.
Therefore, as long as 0.7360 holds on the upside, look for a new drop with targets at 0.7300 and 0.7280 in extension.
The black line shows the pivot point. Currently, the price is above the pivot point, which is a signal for long positions. If it remains below the pivot point, it will indicate short positions. The red lines show the support levels, while the green line indicates the resistance levels. These levels can be used to enter and exit trades.
Resistance levels: 0.7375, 0.7400, and 0.7450.
Support levels: 0.7300, 0.7280, and 0.7250.
The material has been provided by InstaForex Company - www.instaforex.com


No comments:
Post a Comment