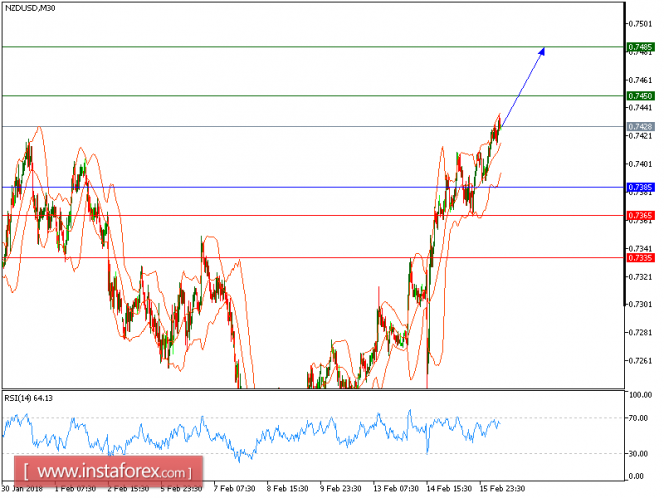
Our first target which we predicted in previous analysis has been hit. NZD/USD is expected to trade with a bullish outlook. The pair posted a rebound from the key support at 0.7365 and broke above its 20-period and 50-period moving averages. The relative strength index is above its neutrality level at 50.
As long as 0.7385 is not broken, look for a further advance with targets at 0.7450 and 0.7485 in extension.
The black line shows the pivot point. Currently, the price is above the pivot point, which is a signal for long positions. If it remains below the pivot point, it will indicate short positions. The red lines show the support levels, while the green line indicates the resistance levels. These levels can be used to enter and exit trades.
Resistance levels: 0.7325, 0.7355, and 0.7385.
Support levels: 0.7365, 0.7335, and 0.7300.
The material has been provided by InstaForex Company - www.instaforex.com


No comments:
Post a Comment