Overview:
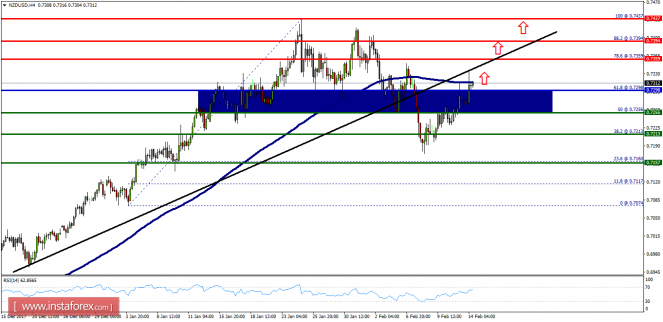
- The NZD/USD pair is still trading upwards above the level of 0.7213 on the H4 chart. Today, the first resistance level is seen at 0.7359 followed by 0.7394, while the daily support 1 is seen at 0.7213 (38.2% Fibonacci retracement). According to the previous events, the NZD/USD pair is still moving between the levels of 0.7255 and 0.7359; so we expect a range of 104 pips. Furthermore, if the trend is able to break out through the pivot point at 0.7298, it should see the pair climbing towards the first resistance (0.7359) to test it. Therefore, buy above the level of 0.7298 with the first target at 0.7359 in order to test the daily resistance 1 and further to 0.7394. Also, it might be noted that the level of 0.7394 is a good place to take profit. On the other hand, in case a reversal takes place, and the NZD/USD pair breaks through the support level of 0.7213, a further decline to 0.7157 can occur which would indicate a bearish market.


No comments:
Post a Comment