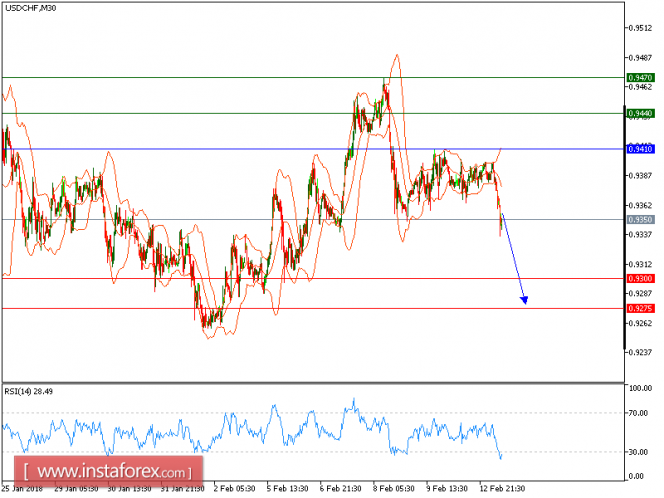
USD/CHF is under pressure. The pair is trading below the key resistance at 0.9410 (the high of February), which should maintain the selling pressure. The relative strength index lacks upward momentum. Even though a continuation of the technical rebound cannot be ruled out, its extent should be limited.
Therefore, below 0.9410, look for a return with targets at 0.9300 and 0.9275 in extension.
Chart Explanation: The black line shows the pivot point. The present price above the pivot point indicates a bullish position, and the price below the pivot point indicates a short position. The red lines show the support levels, and the green line indicates the resistance levels. These levels can be used to enter and exit trades.
Strategy: SELL, stop loss at 0.9410, take profit at 0.9300.
Resistance levels: 0.9440, 0.9470, and 0.9500
Support levels: 0.9300, 0.9275, and 0.9240.
The material has been provided by InstaForex Company - www.instaforex.com


No comments:
Post a Comment