Overview:
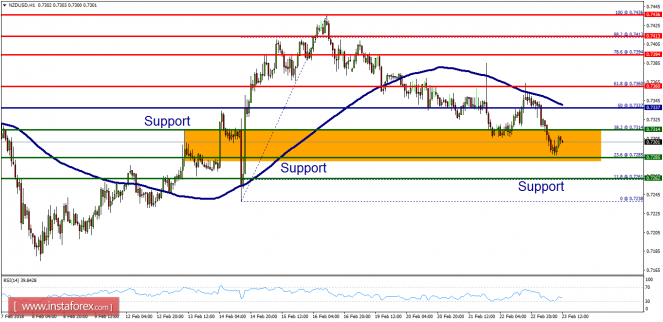
- The NZD/USD pair continued moving upwards from the spot of 0.7285. This week, the pair rose from the area of 0.7285 (support zone) to the top around 0.7310. Today, the first support level is seen at 0.7285 followed by 0.7262 and 0.7238, while the daily resistance is seen at 0.7360. According to the previous events, the NZD/USD pair is still moving between the levels of 0.7285 and 0.7394. Hence, we expect a range of 109 pips in coming hours. This would suggest a bullish market because the RSI indicator is still in a positive area and does not show any trend-reversal signs. Furthermore, if the trend is able to break out through the first resistance level of 0.7360, we should see the pair climbing towards the second resistance (0.7374) to test it. On the contrary, if a breakout takes place at the support level of 0.7285 , then this scenario may become invalidated. Remember to place a stop loss; it should be set below the second support of 0.7203.


No comments:
Post a Comment