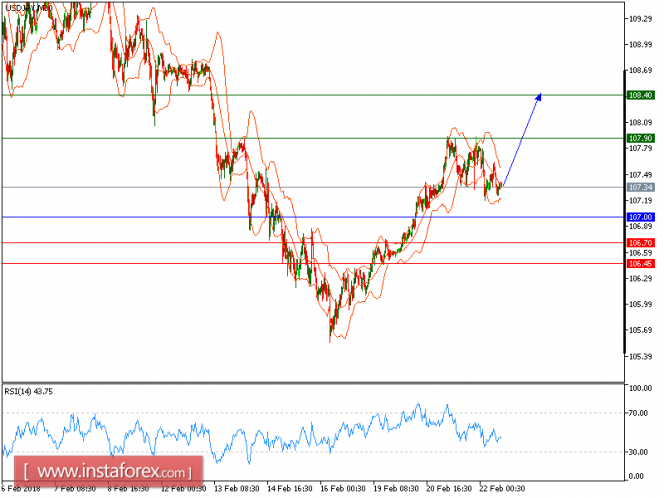
USD/JPY is expected to trade with bullish above 107.00. The pair keeps challenging the overhead resistance at 107.90. Currently intraday bullishness is maintained by those well-directed 20-period and 50-period moving averages. And the relative strength index refuses to stay below the neutrality level of 50, showing a lack of downward momentum for the pair. Upon crossing 107.90, the pair should proceed toward the second upside target at 108.40.
Alternatively, if the price moves in the opposite direction, a short position is recommended to be above 107.00 with a target of 107.90.
Chart Explanation: The black line shows the pivot point. The current price above the pivot point indicates a bullish position, while the price below the pivot point is a signal for a short position. The red lines show the support levels, and the green line indicates the resistance level. These levels can be used to enter and exit trades.
Strategy: BUY, stop loss at 107.00, take profit at 107.90.
Resistance levels: 107.90, 108.40, and 108.45
Support levels: 106.70, 106.45, and 106.00.
The material has been provided by InstaForex Company - www.instaforex.com


No comments:
Post a Comment