GBP/USD is having a bullish momentum across the board as it managed to break above the 200 SMA. Such a move could open the doors to test the resistance zone of 1.4078. However, as long as the bearish structure remains below the 1.4078 level, the pair could scope to test fresh lows below the support area of 1.3753. The MACD indicator stays in the positive territory, favoring the bulls.
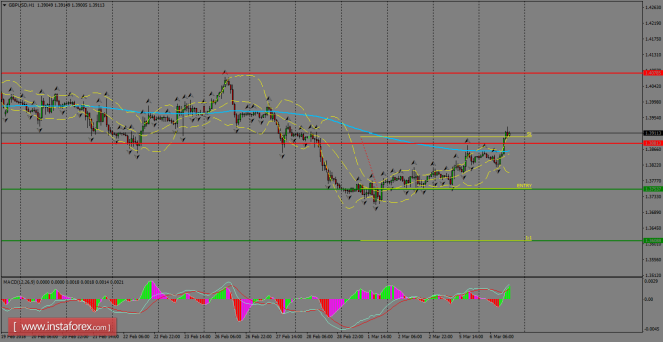
H1 chart's resistance levels: 1.3881 / 1.4078
H1 chart's support levels: 1.3753 / 1.3608
Trading recommendations for today: Based on the H1 chart, sell (short) orders only if the GBP/USD pair breaks a bearish candlestick; the resistance level is at 1.3753, take profit is at 1.3608 and stop loss is at 1.3901.
The material has been provided by InstaForex Company - www.instaforex.com


No comments:
Post a Comment