The Gold price is still trading below the Ichimoku cloud in the 4hour chart. The trend remains bearish. Important short-term resistance is just above $1,330. Bulls need to break it in order to continue to the bounce higher.
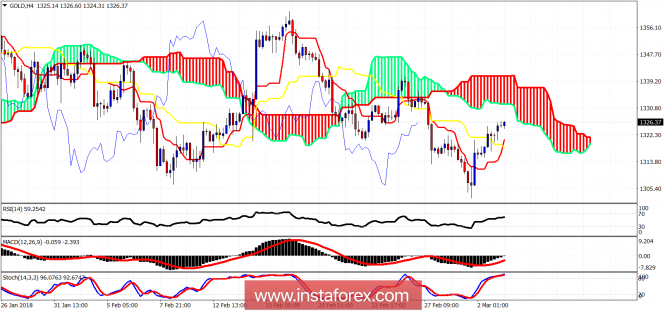
Magenta line - long-term resistance
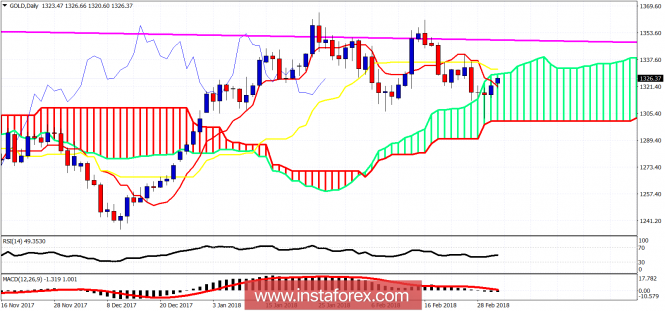
The Gold price in the Daily chart remains inside the Kumo. The trend is neutral. Resistance is at the upper cloud boundary at $1,330-31. Support is at $1,300. As long as the price is above $1,300 and below $1,331 I prefer to be neutral or sell near resistance or buy near support. A break of either level will turn me bearish or bullish respectively.
The material has been provided by InstaForex Company - www.instaforex.com


No comments:
Post a Comment