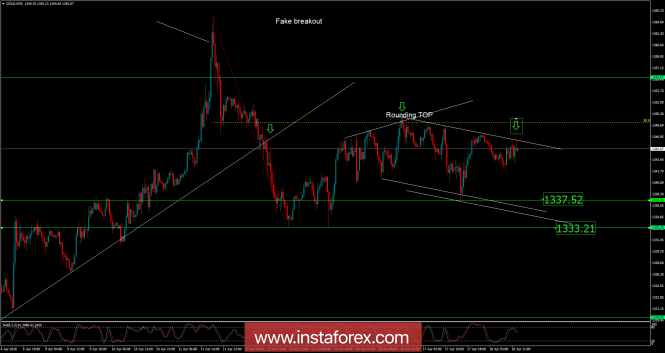
Recently, Gold has been trading sideways at the price of $1,345.25. According to the M30 time – frame, I found that price is respecting supply trendline, which is a sign that sellers are active. I also found a rounding top pattern, which is another sign of weakness. My advice is to watch for potential selling opportunities as long that price remains below the supply trendline. The downward targets are set at the price of $1,337.50 and at the price fo $1,333.20.
Resistance levels:
R1: $1,351.90
R2: $1,356.50
R3: $1,363.62
Support levels:
S1: $1,340.16
S2: $1,333.05
S3: $1,328.45
Trading recommendations for today: watch for potential selling opportunities.
The material has been provided by InstaForex Company - www.instaforex.com


No comments:
Post a Comment