GBP/USD was hit by a strong selling wave on Friday following the UK and US GDP releases. In the meantime, we're seeing a bullish reaction in the greenback, so a possible lower low pattern formation could happen this week. The support zone of 1.3768 should give up in order to allow a lower extension towards the 1.3707 level.
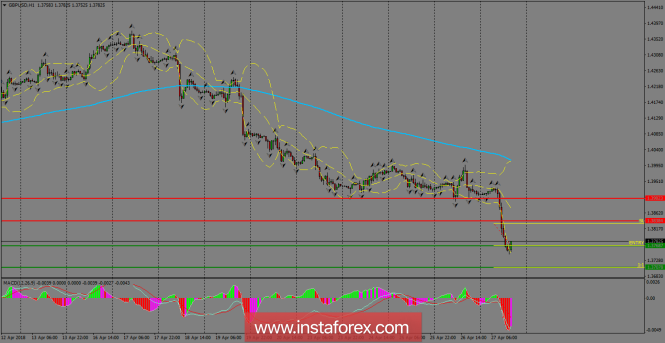
H1 chart's resistance levels: 1.3838 / 1.3902
H1 chart's support levels: 1.3768 / 1.3707
Trading recommendations for today: Based on the H1 chart, sell (short) orders only if the GBP/USD pair breaks a bullish candlestick; the resistance level is at 1.3768, take profit is at 1.3707 and stop loss is at 1.3831.The material has been provided by InstaForex Company - www.instaforex.com


No comments:
Post a Comment