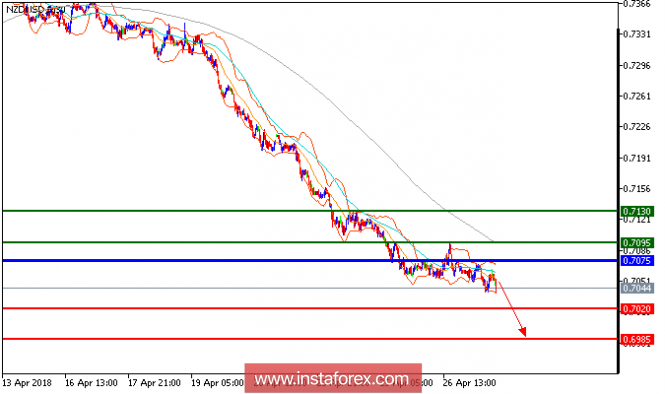
Our first downside target which we predicted in the previous analysis has been hit. NZD/USD is under pressure and expected to continue its downside movement. The pair remains under pressure below its nearest resistance at 0.7100, which is expected to hold any upside room. The 20-period moving average has reversed down, and is now crossing below the 50-period one (a negative signal). In addition, the relative strength index is bearish below its neutrality area at 50. In which case, as long as 0.7075 is not surpassed, it's likely to decline to 0.7020 and 0.6985 in extension.
Chart Explanation: The black line shows the pivot point. Currently, the price is above the pivot point, which is a signal for long positions. If it remains below the pivot point, it will indicate short positions. The red lines show the support levels, while the green line indicates the resistance levels. These levels can be used to enter and exit trades.
Resistance levels: 0.7095, 0.7130, and 0.7165
Support levels: 0.7020, 0.6985, and 0.6945.
The material has been provided by InstaForex Company - www.instaforex.com


No comments:
Post a Comment