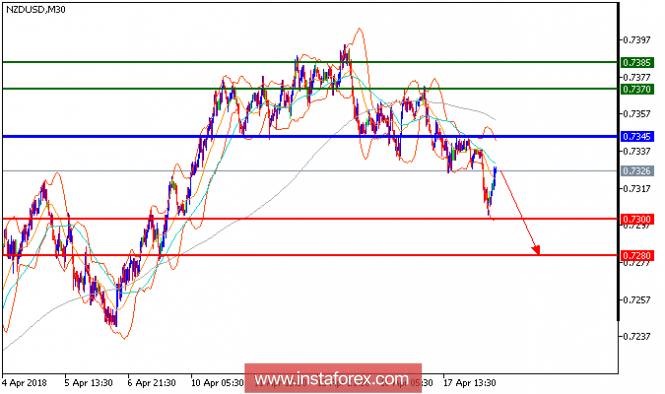
All our targets which we predicted in yesterday's analysis have been hit. NZD/USD is still under pressure. Although the pair posted a rebound from 0.7325 (the low of April 17), it is still capped by a declining 50-period moving averages. The key resistance at 0.7345 should remain intact and maintain the selling pressure. Hence, as long as this key level is not surpassed, look for another drop with targets at 0.7300 and 0.7280 in extension.
Chart Explanation: The black line shows the pivot point. Currently, the price is above the pivot point which is a signal for long positions. If it remains below the pivot point, it will indicate short positions. The red lines show the support levels, while the green line indicates the resistance levels. These levels can be used to enter and exit trades.
Resistance levels: 0.7370, 0.7385, and 0.7425
Support levels: 0.7300, 0.7280, and 0.7245.
The material has been provided by InstaForex Company - www.instaforex.com


No comments:
Post a Comment