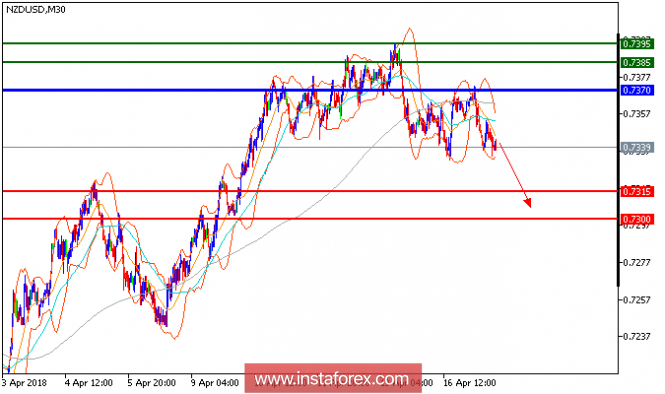
NZD/USD is expected to trade with a bearish outlook. The pair is under pressure below the key resistance at 0.8650, which should limit the upside potential. Both declining 20-period and 50-period moving averages should push the prices lower. The relative strength index lacks upward momentum. To sum up, below 0.7370, look for a further decline with targets at 0.7315 and 0.7300 in extension.
Chart Explanation: The black line shows the pivot point. Currently, the price is above the pivot point which is a signal for long positions. If it remains below the pivot point, it will indicate short positions. The red lines show the support levels, while the green line indicates the resistance levels. These levels can be used to enter and exit trades.
Resistance levels: 0.7385, 0.7395, and 0.7450
Support levels: 0.7315, 0.7300, and 0.7265.
The material has been provided by InstaForex Company - www.instaforex.com


No comments:
Post a Comment