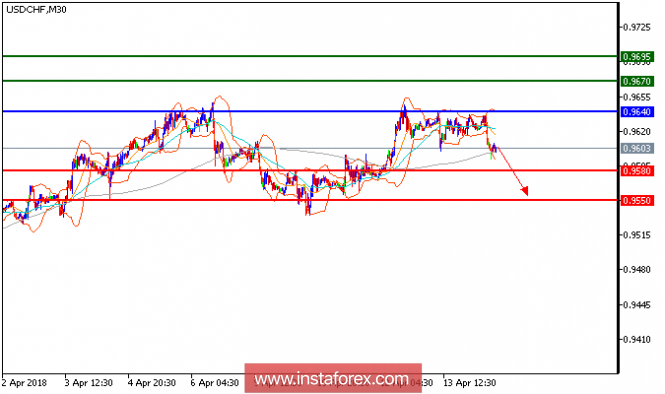
USD/CHF is expected to trade with bullish outlook. The pair retreated and broke below its 20-period and 50-period moving averages. In addition, the death cross between 20-period and 50-period moving averages has been identified. The relative strength index is below it neutrality level at 50. Therefore, as long as 0.9640 holds on the upside, a further decline to 0.9580 and even to 0.9550 seems more likely to occur.
Chart Explanation: The black line shows the pivot point. The present price above the pivot point indicates a bullish position, and the price below the pivot point indicates a short position. The red lines show the support levels, and the green line indicates the resistance levels. These levels can be used to enter and exit trades.
Strategy: SELL, stop loss at 0.9640, take profit at 0.9580.
Resistance levels: 0.9670, 0.9695, and 0.9740
Support levels: 0.9580, 0.9550, and 0.9500.
The material has been provided by InstaForex Company - www.instaforex.com


No comments:
Post a Comment