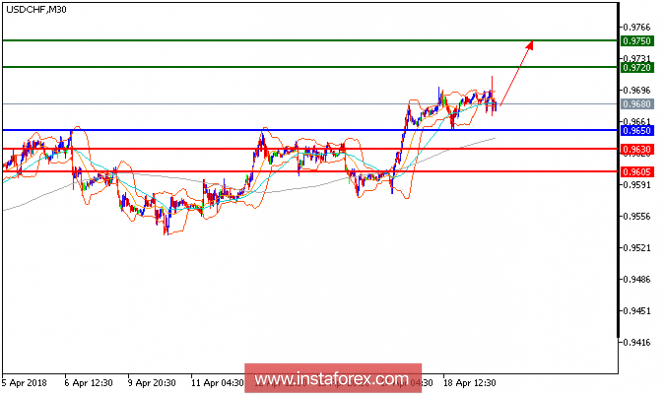
USD/CHF is expected to trade with a bullish outlook. The pair made a rebound from 0.9650 (the low of April 18) and broke above its 20-period moving and 50-period moving averages. Besides, the rising 50-period moving average should push the prices higher. The relative strength index is above its neutrality level at 50. Hence, as long as 0.9650 is not broken, look for a further upside with targets at 0.9720 and 0.9750 in extension.
Chart Explanation: The black line shows the pivot point. The present price above the pivot point indicates a bullish position, and the price below the pivot point indicates a short position. The red lines show the support levels, and the green line indicates the resistance levels. These levels can be used to enter and exit trades.
Strategy: BUY, stop loss at 0.9650, take profit at 0.9720.
Resistance levels: 0.9720, 0.9750, and 0.9790
Support levels: 0.9630, 0.9605, and 0.9560.
The material has been provided by InstaForex Company - www.instaforex.com


No comments:
Post a Comment