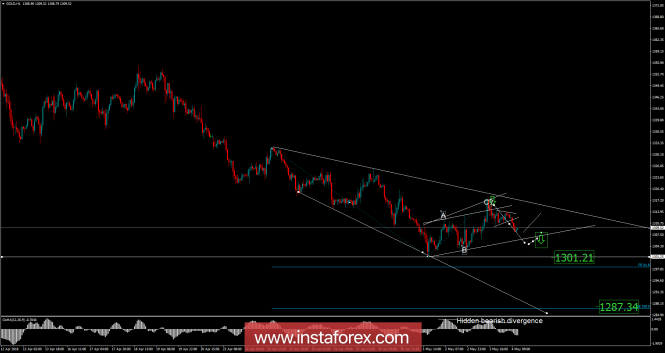
Recently, Gold has been trading sideways at the price of$1,309.00. According to the H1 time frame, I found that Gold is trading inside of the upward channel (a potential bearish flag), which is a sign that selling looks risky. I also found a potential expanding diagonal pattern, which is another sign of weakness. My advice is to watch for potential selling opportunities only if you see a valid breakout of flag ($1,305.00). Downward targets are set at the price of $1,301.20 and $1,287.35.
Resistance levels:
R1: $1,318.77
R2: $1,325.38
R3: $1,332.65
Support levels:
S1: $1,304.90
S2: $1,297.65
S3: $1,291.03
Trading recommendations for today: watch for potential selling opportunities if you see a valid breakout of the bearish flag.
The material has been provided by InstaForex Company - www.instaforex.com


No comments:
Post a Comment