The selling pressure remains as the main headliner across the board for GBP/USD, as the momentum is easing. It seems we could expect a leg lower to test the support level of 1.3480. The 200 SMA continues to provide a guide for the overall path, so it could act as a dynamic resistance when it coincides with the resistance zone of 1.3733.
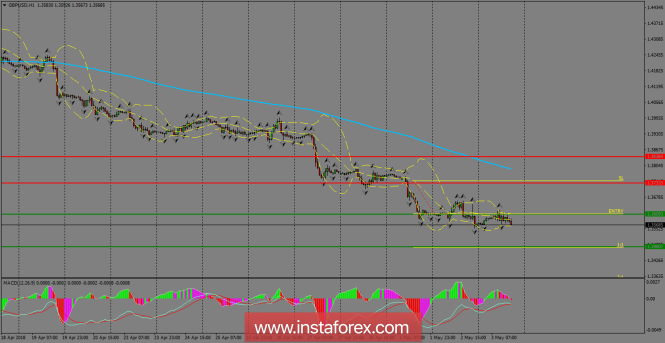
H1 chart's resistance levels: 1.3733 / 1.3838
H1 chart's support levels: 1.3609 / 1.3480
Trading recommendations for today: Based on the H1 chart, sell (short) orders only if the GBP/USD pair breaks a bullish candlestick; the resistance level is at 1.3609, take profit is at 1.3480 and stop loss is at 1.3743.
The material has been provided by InstaForex Company - www.instaforex.com


No comments:
Post a Comment