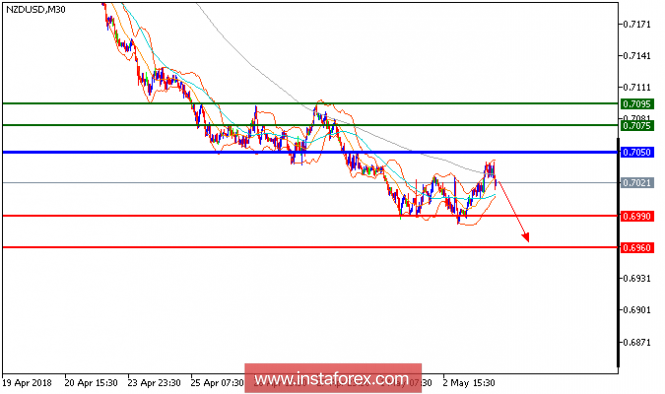
NZD/USD is expected to trade with bearish outlook. Although the pair is rebounding from around 0.6990, but its extent should be limited. The pair remains under pressure below its nearest key resistance at 0.7050, and is now testing the support at 0.6985. The process of lower highs and lows remains intact on the prices, which should confirm a negative outlook. Last but not least, a bearish cross has been identified between the 20-period and 50-period moving averages. In which case, as long as 0.7030 is not surpassed, it is likely to decline to 0.6990 and 0.6960 in extension.
Chart Explanation: The black line shows the pivot point. Currently, the price is above the pivot point, which is a signal for long positions. If it remains below the pivot point, it will indicate short positions. The red lines show the support levels, while the green line indicates the resistance levels. These levels can be used to enter and exit trades.
Resistance levels: 0.7075, 0.7095, and 0.7120. Support levels: 0.6990, 0.6960, and 0.6920.
The material has been provided by InstaForex Company - www.instaforex.com


No comments:
Post a Comment