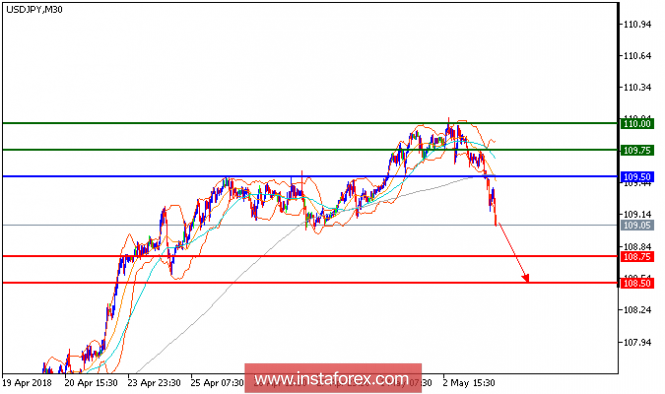
USD/JPY is under pressure and turned back after hitting 110.00. The pair is accelerating on the downside, capped by its descending 20-period and 50-period moving averages. The key resistance at 109.50 maintains the strong selling pressure on the prices. Last but not least, the relative strength index is bearish, and calls for further downside. In these perspectives, as long as 109.50 is not surpassed, likely decline to 108.75 and 108.50 in extension.
Chart Explanation: The black line shows the pivot point. The present price above the pivot point indicates a bullish position, and the price below the pivot point indicates a short position. The red lines show the support levels, and the green line indicates the resistance levels. These levels can be used to enter and exit trades.
Strategy: SELL, stop loss at 109.50, take profit at 108.75.
Resistance levels: 109.75, 110.00, and 110.75
Support levels: 108.75, 108.50, and 108.00.
The material has been provided by InstaForex Company - www.instaforex.com


No comments:
Post a Comment