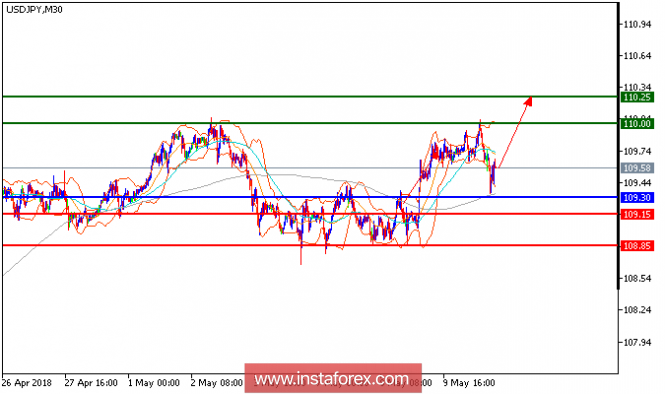
USD/JPY is expected to post some further upside targets. The pair broke above the upper boundary of Bollinger Bands, indicating the potential of upward acceleration. The upside momentum is further reinforced by the rising 50-period moving average. The relative strength index is locating at 60s, calling for a new upleg. Hence, as long as 109.30 holds on the downside, look for a new challenge with targets at 110.00 and 110.25 in extension.
Chart Explanation: The black line shows the pivot point. The present price above the pivot point indicates a bullish position, and the price below the pivot point indicates a short position. The red lines show the support levels, and the green line indicates the resistance levels. These levels can be used to enter and exit trades.
Strategy: BUY, stop loss at 109.30, take profit at 110.
Resistance levels: 110, 110.25, and 110.55
Support levels: 109.15, 108.85, and 108.30.
The material has been provided by InstaForex Company - www.instaforex.com

No comments:
Post a Comment