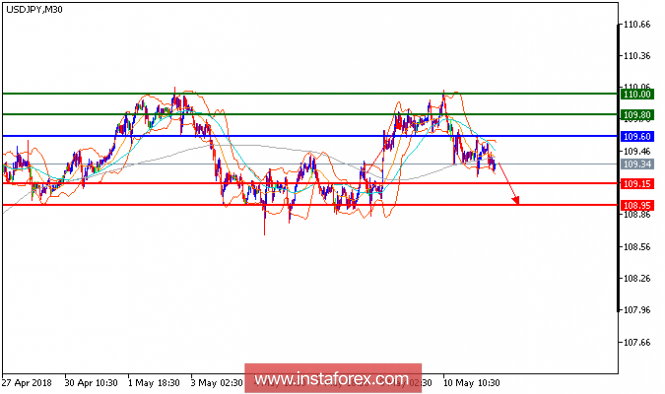
USD/JPY is expected to post some further upside targets. The pair is under pressure below its key resistance at 109.60, which should limit the upside potential. The 20-period moving average turned downward and crossed below the 50-period one. The relative strength index is below its neutrality level at 50 and lacks upward momentum. Therefore, as long as 109.60 is not surpassed, look for a return with targets at 109.15 and 108.95 in extension.
Chart Explanation: The black line shows the pivot point. The present price above the pivot point indicates a bullish position, and the price below the pivot point indicates a short position. The red lines show the support levels, and the green line indicates the resistance levels. These levels can be used to enter and exit trades.
Strategy: SELL, stop loss at 109.60, take profit at 109.15.
Resistance levels: 109.60, 110.00, and 110.35
Support levels: 109.15, 108.95, and 108.50.
The material has been provided by InstaForex Company - www.instaforex.com


No comments:
Post a Comment