The Dollar index started weak on Monday but found support at the Ichimoku cloud, at the 38% Fibonacci retracement and at the broken resistance trend line.
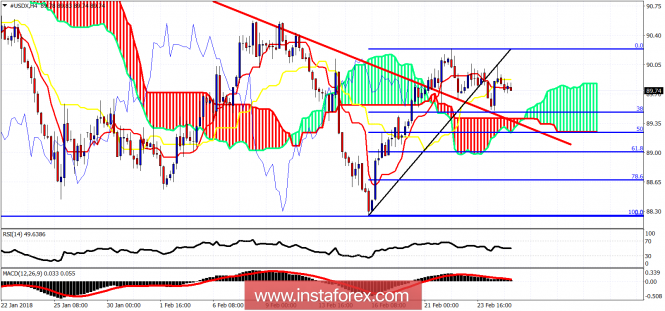
The Dollar index bounced right off support. This support is at 89.50. As long as price is above that level bulls have hopes. Resistance is at 90.05. A break above resistance would be a very bullish sign for the index and if it happens, I would expect price to move towards 91-92.
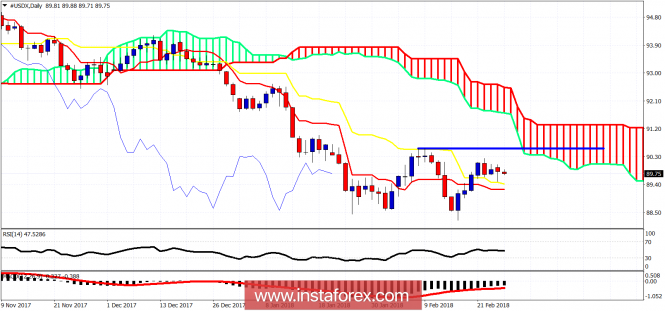
On a daily basis the Dollar index remains above both indicators. But also below the daily Kumo. Bulls need to break above the blue resistance at 90.60 for a bigger bounce to be seen. As long as we are below 90.60, there is still a big danger of seeing another sell off in the Dollar index towards 87-86.
The material has been provided by InstaForex Company - www.instaforex.com


No comments:
Post a Comment