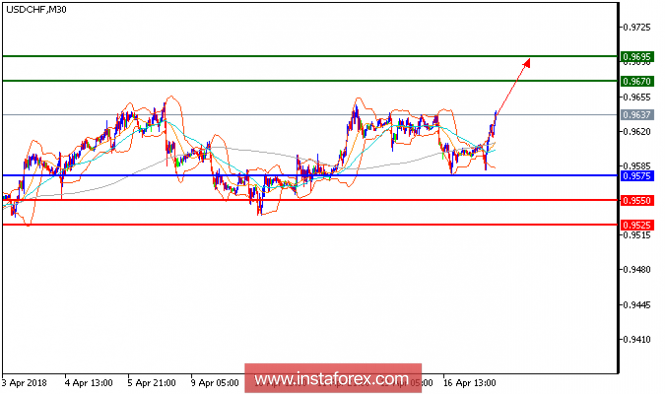
USD/CHF is expected to trade with a bullish outlook. The pair edged higher and broke above its key resistance at 0.9575, which becomes the key support now. The rising 50-period moving average plays a support role and maintain the upside bias. The relative strength index is bullish, calling for a further upside. Hence, above 0.9575, look for a new challenge with targets at 0.9670 and 0.9695 in extension.
Chart Explanation: The black line shows the pivot point. The present price above the pivot point indicates a bullish position, and the price below the pivot point indicates a short position. The red lines show the support levels, and the green line indicates the resistance levels. These levels can be used to enter and exit trades.
Strategy: BUY, stop loss at 0.9575, take profit at 0.9670.
Resistance levels: 0.9670, 0.9695, and 0.9740
Support levels: 0.9550, 0.9525, and 0.9500.
The material has been provided by InstaForex Company - www.instaforex.com


No comments:
Post a Comment