Technical outlook:
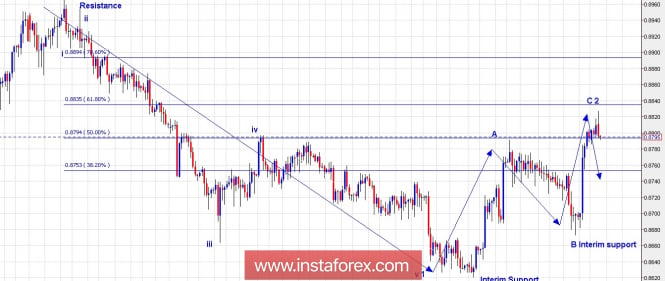
The EUR/GBP H4 chart view shows an intermediate wave structure. The price action since March 2017 till now has unfolded into an impulse (5 waves), followed by a zigzag (3 waves) as seen here. Please note that EUR/GBP dropped between 0.8960 through 0.8620 levels unfolding into 5 waves as labelled here. The subsequent rally can be seen unfolding as 3 wave corrective structure labelled as A-B-C. If the above counts hold to be true, the next probable move is expected lower towards 0.8100/8200 levels in the coming weeks. Looking into the wave counts of a larger degree, EUR/GBP seems to have completed Waves 1 and 2 as labelled here, and is into its wave 3 lower now. Also note that the pair has found resistance just shy of the Fibonacci 0.618 retracement at 0.8830/40 levels. Please prepare for another bear leg from here.
Trading plan:
Short now around 0.8800 levels, stop above 0.8960 levels, target lower towards 0.8200 levels at least. Please note that this is a positional trade.
Fundamental outlook:
Watch out for the US PCE Core at 08:30 AM EST, respectively.
Good luck!The material has been provided by InstaForex Company - www.instaforex.com
No comments:
Post a Comment