Technical outlook;
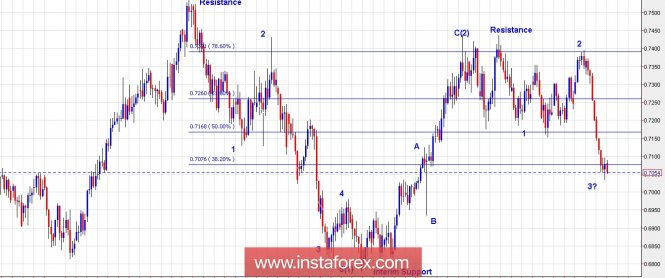
The NZD/USD daily chart view has been presented here to have a bigger picture of the wave structure. Please note that the pair produced its impulse wave lower between July and November 2017. As labelled here, NZD/USD dropped into 5 waves lower during this period. The subsequent rally unfolded into a zigzag A-B-C, and prices pushed through the Fibonacci 0.786 resistance zone through 0.7400/40 levels before turning lower again. The above wave counts indicate that NZD/USD pair has completed waves (1) and (2), and is now unfolding into wave (3), which seems to be into its early stages at present. Please note that the current wave should terminate subsequently below 0.6800 levels going forward. Major resistance is seen at 0.7450 and 0.7550 levels. Any subsequent rallies through 0.7200/0.7300 levels should be considered as opportunities to initiate short positions.
Trading plan:
Positional traders may remain short with stop above 0.7450 levels. Intraday/interday rallies should be taken as opportunities to go short again.
Fundamental outlook:
Watch out for German consumer Price Index and US PCE Core at 08:00 AM EST and 08:30 AM EST, respectively.
Good luck!
The material has been provided by InstaForex Company - www.instaforex.com
No comments:
Post a Comment