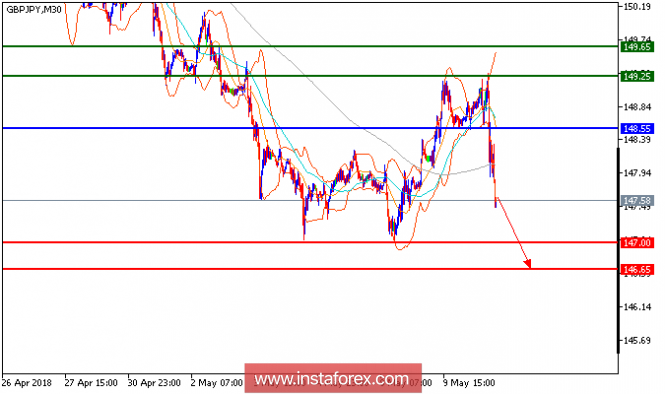
GBP/JPY is under pressure. The pair confirmed a bearish reversal after the recent downside breakout of its 50-period moving average. The 20-period moving average is also turning down, and is about to cross below the 50-period one. In addition, the relative strength index remains weak below its neutrality area at 50, without showing any reversal signal. In which case, as long as the resistance at 148.55 is not surpassed, the risk of the break below 147.00 remains high.
Chart Explanation: The black line shows the pivot point. Currently, the price is above the pivot point which is a signal for long positions. If it remains below the pivot point, it will indicate short positions. The red lines show the support levels, while the green line indicates the resistance levels. These levels can be used to enter and exit trades.
Resistance levels: 149.25,149.65, and 150.00
Support levels: 147, 146.65, and 146
The material has been provided by InstaForex Company - www.instaforex.com


No comments:
Post a Comment