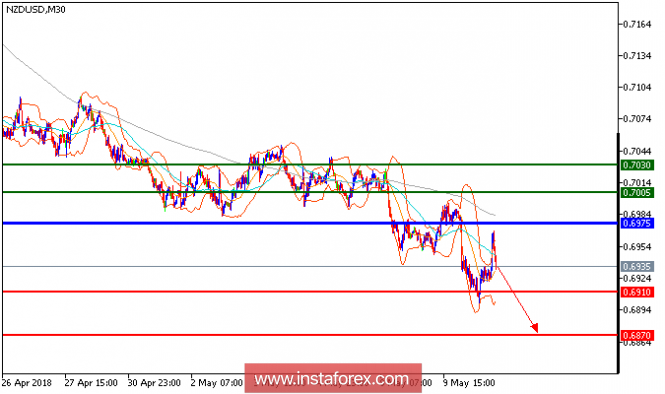
NZD/USD is expected to trade with a bearish outlook. The pair posted a strong decline yesterday, and is now under pressure below its nearest resistance at 0.6975. A bearish cross has been identified between the 20-period and 50-period moving averages. Furthermore, the relative strength index is negative below its neutrality area at 50. To conclude, as long as 0.6975 is not surpassed, likely decline to 0.6910 and 0.6870 in extension.
Chart Explanation: The black line shows the pivot point. Currently, the price is above the pivot point, which is a signal for long positions. If it remains below the pivot point, it will indicate short positions. The red lines show the support levels, while the green line indicates the resistance levels. These levels can be used to enter and exit trades.
Resistance levels: 0.7005, 0.7030, and 0.7075.Support levels: 0.6910, 0.6870, and 0.6835.
The material has been provided by InstaForex Company - www.instaforex.com


No comments:
Post a Comment