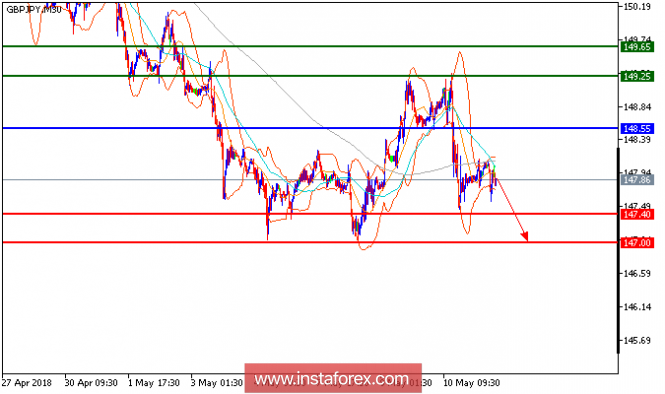
GBP/JPY is under pressure. The pair remains weak below its nearest horizontal resistance at 148.55. Both the 20-period and 50-period moving averages are turning down, and call for further decline. Additionally, the relative strength index is negative below its neutrality area at 50. Therefore, as long as 148.55 is not surpassed, likely decline to 147.40 at first. A break below 147.40 would trigger a drop towards 1.47.00.
Chart Explanation: The black line shows the pivot point. Currently, the price is above the pivot point which is a signal for long positions. If it remains below the pivot point, it will indicate short positions. The red lines show the support levels, while the green line indicates the resistance levels. These levels can be used to enter and exit trades.
Resistance levels: 149.25,149.65, and 150.20
Support levels: 147.40, 147.00, and 146.20
The material has been provided by InstaForex Company - www.instaforex.com


No comments:
Post a Comment