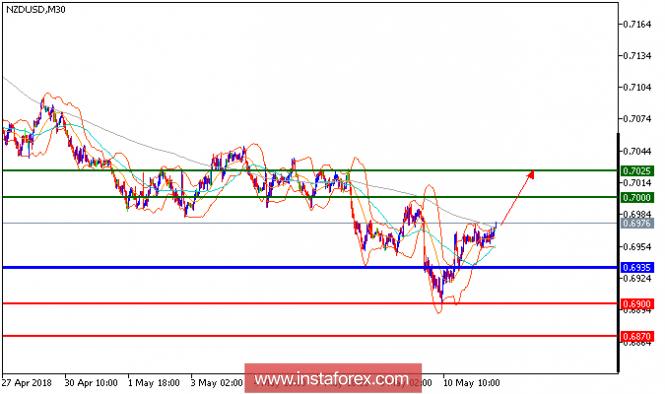
NZD/USD is expected to trade with a bullish outlook. The pair has rebounded on its horizontal support at 0.6935, which should limit any downward attempts. The RSI has just landed on its neutrality area at 50% and is turning up. Last but not least, the rising 50-period moving average acts as a strong support role. To conclude, as long as 0.6935 is not broken, likely advance to 0.7000 and 0.7025 in extension.
Chart Explanation: The black line shows the pivot point. Currently, the price is above the pivot point, which is a signal for long positions. If it remains below the pivot point, it will indicate short positions. The red lines show the support levels, while the green line indicates the resistance levels. These levels can be used to enter and exit trades.
Resistance levels: 0.7000, 0.7025, and 0.7075.
Support levels: 0.6900, 0.6870, and 0.6835.
The material has been provided by InstaForex Company - www.instaforex.com


No comments:
Post a Comment