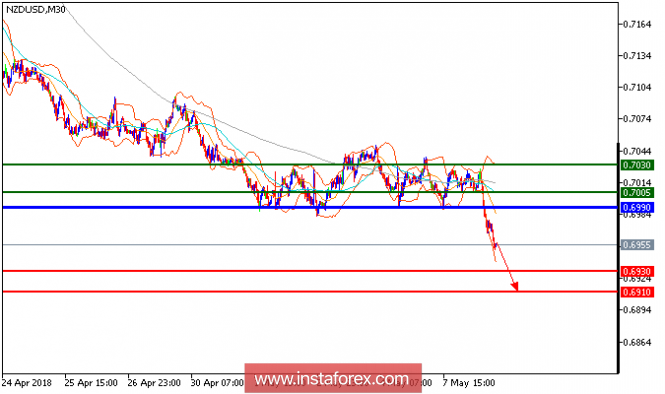
All our downside targets which we predicted in yesterday's analysis have been hit. The pair keeps trading on the downside after peaking at 0.7075. Currently, it is capped by a descending 50-period moving average, and the relative strength index remains subdued below the neutrality level of 50, signaling a downside momentum for the pair. So, as long as the key resistance at 0.6990 is not surpassed, the pair stands higher chances of breaking 0.6930 and even 0.6910 on the downside.
Chart Explanation: The black line shows the pivot point. Currently, the price is above the pivot point, which is a signal for long positions. If it remains below the pivot point, it will indicate short positions. The red lines show the support levels, while the green line indicates the resistance levels. These levels can be used to enter and exit trades.
Resistance levels: 0.7005, 0.7030, and 0.7075.
Support levels: 0.6930, 0.6910, and 0.6850.
The material has been provided by InstaForex Company - www.instaforex.com

No comments:
Post a Comment