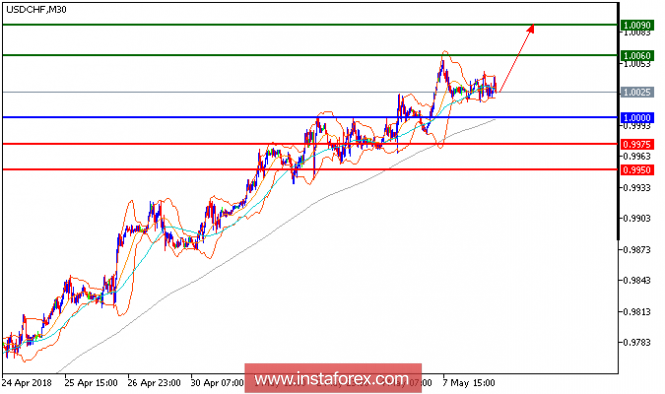
All our upside targets which we predicted in the previous analysis have been hit. The pair resumed its upside momentum after the bullish penetration of its key psychological level at 1.0000, which is now acting as strong support. The process of higher highs and lows remains intact on the prices, which should confirm the bullish outlook. Therefore, even though a consolidation cannot be ruled out, its extent should be limited before further advance to 1.0060 and 1.0090 in extension.
Chart Explanation: The black line shows the pivot point. The present price above the pivot point indicates a bullish position, and the price below the pivot point indicates a short position. The red lines show the support levels, and the green line indicates the resistance levels. These levels can be used to enter and exit trades.
Strategy: BUY, stop loss at 1.0000, take profit at 1.0060.
Resistance levels: 1.0060, 1.0090, and 1.0120
Support levels: 0.9975, 0.9950, and 0.9900
The material has been provided by InstaForex Company - www.instaforex.com


No comments:
Post a Comment