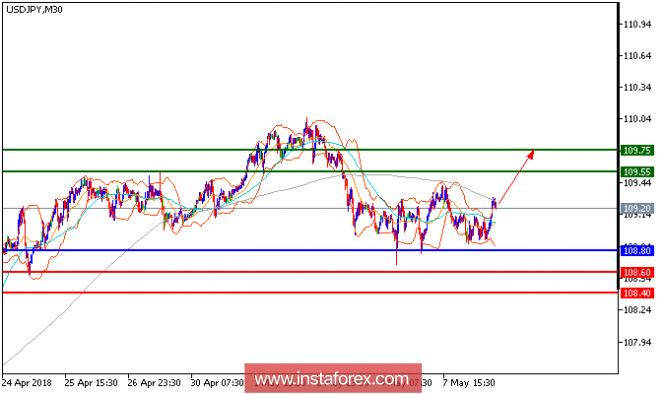
USD/JPY is expected to trade with a bullish outlook. Although the pair posted a pullback from 109.30, it is still trading above its key support at 108.80, which should limit the downside potential. The relative strength index has landed on its neutrality level at 50 and is turning up. To conclude, as long as 108.80 is not broken, look for another rebound with targets at 109.55 and 109.75 in extension.
Chart Explanation: The black line shows the pivot point. The present price above the pivot point indicates a bullish position, and the price below the pivot point indicates a short position. The red lines show the support levels, and the green line indicates the resistance levels. These levels can be used to enter and exit trades.
Strategy: BUY, stop loss at 108.80, take profit at 109.55.
Resistance levels: 109.55, 109.75, and 110.35
Support levels: 108.60, 108.40, and 108.00.
The material has been provided by InstaForex Company - www.instaforex.com


No comments:
Post a Comment