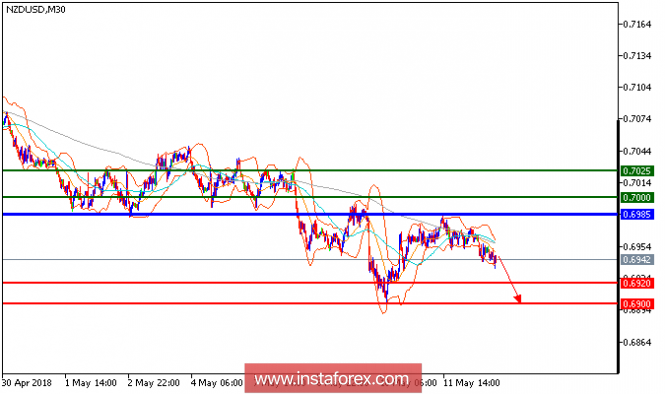
NZD/USD is expected to trade in lower range. The pair continues to show downward momentum while showing a bearish pattern of lower highs. Currently, it has returned to the levels below both the 20-period and 50-period moving averages, targeting the immediate support (first downside target) at 0.6920. The relative strength index remains subdued at the levels below the neutrality level of 50, showing a lack of upward momentum for the pair. Intraday bearishness persists, and a break below 0.6920 would trigger a further decline toward 0.6900.
Chart Explanation: The black line shows the pivot point. Currently, the price is above the pivot point which is a signal for long positions. If it remains below the pivot point, it will indicate short positions. The red lines show the support levels, while the green line indicates the resistance levels. These levels can be used to enter and exit trades.
Resistance levels: 0.7000, 0.7025, and 0.7060
Support levels: 0.6920, 0.6900, and 0.6860
The material has been provided by InstaForex Company - www.instaforex.com


No comments:
Post a Comment