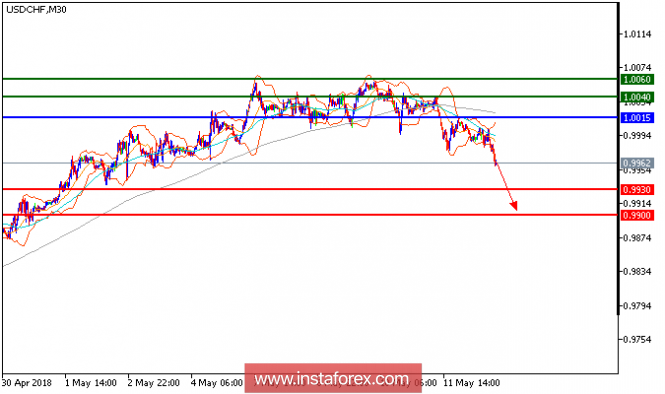
Our first target which we predicted in the previous analysis has been hit. Despite the recent rebound from 0.9975 (around the low of May 11), the pair is still staying below its declining 50-period moving average, which maintains the downside bias. The relative strength index is below its neutrality level at 50 and lacks upward momentum. Therefore, as long as 1.0015 holds on the upside, look for a further decline with targets at 0.9930 and 0.9900 in extension.
Chart Explanation: The black line shows the pivot point. The present price above the pivot point indicates a bullish position, and the price below the pivot point indicates a short position. The red lines show the support levels, and the green line indicates the resistance levels. These levels can be used to enter and exit trades.
Strategy: SELL, stop loss at 1.0015, take profit at 0.9930.
Resistance levels: 1.0040, 1.0060, and 1.0090
Support levels: 0.9930, 0.9900, and 0.9875
The material has been provided by InstaForex Company - www.instaforex.com


No comments:
Post a Comment