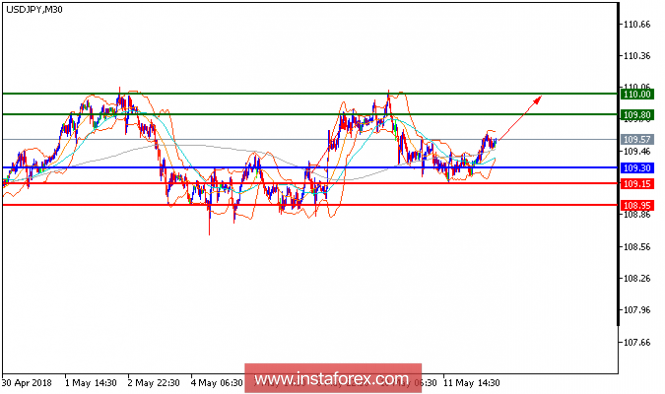
USD/JPY is expected to trade with bullish outlook. The pair is rebounding after touching the rising 50-period moving average. The relative strength index has landed on the neutrality level at 50 and is turning up. The downside potential should be limited by the key support at 109.30. Hence, as long as this key level holds on the downside, look for a bounce with targets at 109.80 and 110.00 in extension.
Chart Explanation: The black line shows the pivot point. The present price above the pivot point indicates a bullish position, and the price below the pivot point indicates a short position. The red lines show the support levels, and the green line indicates the resistance levels. These levels can be used to enter and exit trades.
Strategy: Buy, stop loss at 109.30, take profit at 109.80.
Resistance levels: 109.80, 110.00, and 110.35
Support levels: 109.30, 109.15, and 108.95.
The material has been provided by InstaForex Company - www.instaforex.com


VERY INTERESTING ARTICLE... THANK YOU FOR SHARING THIS KIND OF ARTICLE... REALLY APPRECIATING..
ReplyDeleteThanks for sharing this useful information
ReplyDelete