EUR / JPY pair
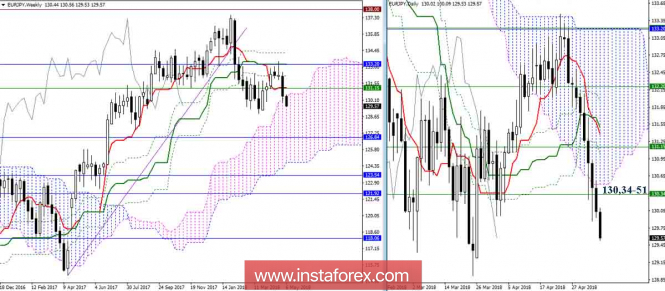
Higher timeframes
The decline continues due to a slight breakout followed by another update of the daily candle minimum, while the bearish market sentiment remains. After fixing on the weekly cloud, the lower boundary of the weekly cloud and the monthly Fibo Kijun (126.84) will serve as a downward reference point in the higher time intervals.
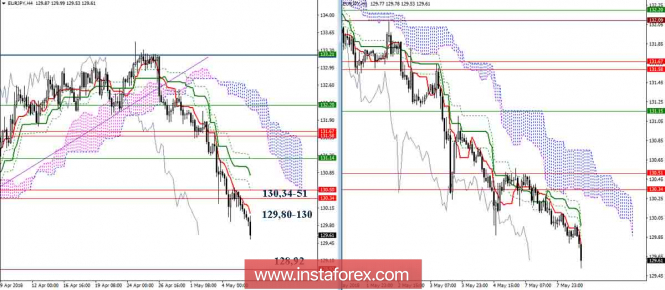
H4 - H1
Players to rise could not go beyond the most significant area of resistance zone (130.34 - 51). As a result, the advantage of the players to fall has been preserved, and by now, they have continued to decline. Currently, we are seeing a downtrend in its active phase. The closest benchmark for the decline and the main task for players to fall in the current situation is to update the minimum extremum (128.92) and restore the weekly downtrend. The most important zone of resistance is the area of 130.34 - 51 and the intermediate level today can be noted at the resistance level of 129.80 - 130 (Tenkan N4 + cross N1).
Indicator parameters:
all time intervals 9 - 26 - 52
Color of indicator lines:
Tenkan (short-term trend) - red,
Kijun (medium-term trend) - green,
Fibo Kijun is a green dotted line,
Chikou is gray,
clouds: Senkou Span B (SSB, long-term trend) - blue,
Senkou Span A (SSA) - pink.
Color of additional lines:
support and resistance MN - blue, W1 - green, D1 - red, H4 - pink, H1 - gray,
horizontal levels (not Ichimoku) - brown,
trend lines - purple.
The material has been provided by InstaForex Company - www.instaforex.com


No comments:
Post a Comment