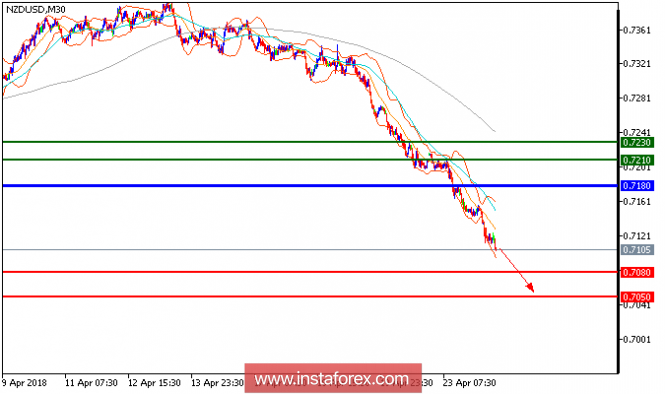
All our downside targets which we predicted in yesterday's analysis have been hit. NZD/USD is still under pressure and expected to continue its downside movement. The pair remains on the downside and is likely to test its next support at 0.7080. Both the 20-period and 50-period moving averages are heading downward and should call for further decline. The nearest key resistance at 0.7180 maintains the strong selling pressure on the prices. To conclude, as long as 0.7180 is not surpassed, likely decline to 0.7080 and 0.7050 in extension.
Fundamental Outlook :
New Zealand's net migration picked up in March as February's unexpected softness in arrivals reversed. The monthly net inflow of 5,480 people was close to Westpac's expectation. Net migration has slowed since mid-2017, and in annual terms is now just below 68,000, the least in 2 years though still strong. Much of the increase in migration in recent years has been due to people arriving on temporary work and student visas.
Chart Explanation: The black line shows the pivot point. Currently, the price is above the pivot point, which is a signal for long positions. If it remains below the pivot point, it will indicate short positions. The red lines show the support levels, while the green line indicates the resistance levels. These levels can be used to enter and exit trades.
Resistance levels: 0.7210, 0.7230, and 0.7275
Support levels: 0.7080, 0.7050, and 0.700.
The material has been provided by InstaForex Company - www.instaforex.com
No comments:
Post a Comment