The pair is consolidating the structure to the downside, following a breakout made below the 1.3768 level. There is a rebound taking in place around 1.3707, as the bulls are trying to gather momentum in order to perform a corrective move. If that happens, the upside should be limited by the 200 SMA on H1 chart. MACD indicator is entering the positive territory, calling for a rebound.
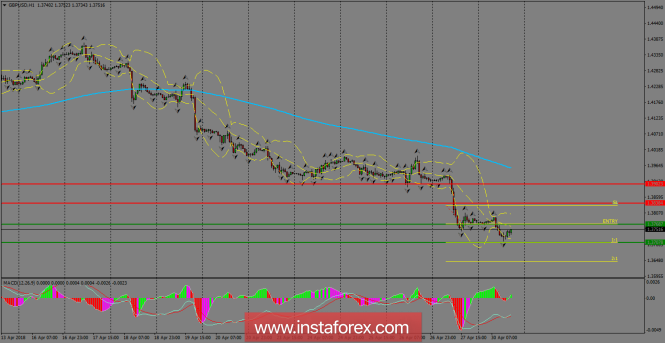
H1 chart's resistance levels: 1.3838 / 1.3902
H1 chart's support levels: 1.3768 / 1.3707
Trading recommendations for today: Based on the H1 chart, sell (short) orders only if the GBP/USD pair breaks a bullish candlestick; the resistance level is at 1.3768, take profit is at 1.3707 and stop loss is at 1.3831.
The material has been provided by InstaForex Company - www.instaforex.com


No comments:
Post a Comment