Despite a thin liquidity in the markets on Monday, the greenback is looking to break above last Friday's highs and now it aims to test the resistance zone of 92.62. As we can see on the H1 chart, USDX already formed three fractals in the lows reached on Friday and Monday respectively. However, if such levels give up, then it can plummet to test the 200 SMA on H1 chart.
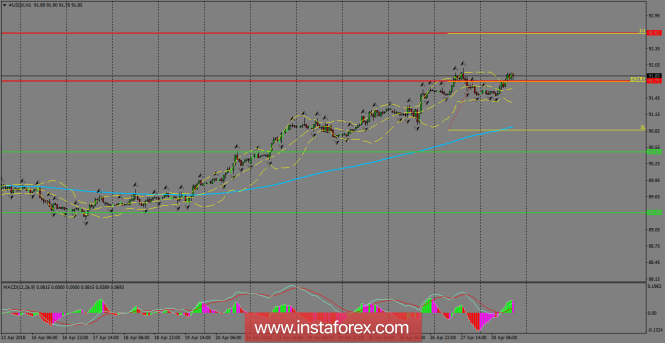
H1 chart's resistance levels: 91.25 / 92.62
H1 chart's support levels: 90.46 / 89.36
Trading recommendations for today: Based on the H1 chart, place buy (long) orders only if the USD Index breaks with a bearish candlestick; the support level is at 91.25, take profit is at 92.62 and stop loss is at 90.86.The material has been provided by InstaForex Company - www.instaforex.com


No comments:
Post a Comment