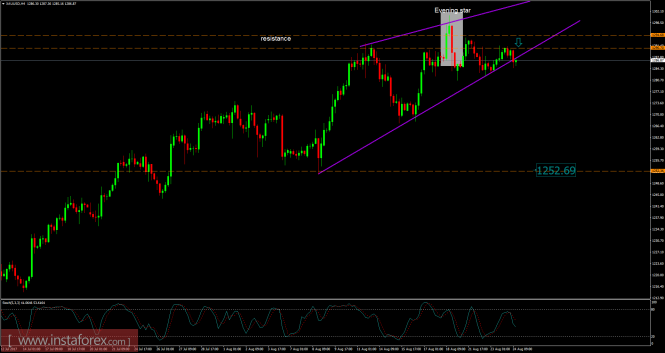
Recently, the Gold has been trading upwards. The price tested the level of $1.3000. Anyway, according to the 4H timeframe, I found a fake breakout of key resistance at the price of $1,291.00, which is a sign that buying looks risky. I found an evening start formation (bearish candle formation), which is another sign of weakness. Stochastic oscillator is showing an overbought condition, which represents a bullish extension. My advice is to watch for potential selling opportunities. The downward target is set at the price of $1,252.70.
Resistance levels:
R1: $1,298.00
R2: $1,302.00
R3: $1,307.50
Support levels:
S1: $1,289.00
S2: $1,284.00
S3: $1,280.00
Trading recommendations for today: watch for potential selling opportunities.
The material has been provided by InstaForex Company - www.instaforex.com


No comments:
Post a Comment